
Technical Analysis for Long-Term Investors
Using price action to improve entry, exit, and risk discipline without turning long-term investing into short-term trading.

Most long-term investors are taught to ignore charts. I understand why.
A lot of technical analysis gets presented as prediction theater: a line crosses another line, a pattern appears, and suddenly someone claims to know exactly where a stock is going next. That is not how I think long-term investors should use it. The better use of technical analysis is humbler: It helps us understand when the market is starting to agree with, reject, or reconsider a fundamental thesis.
Fundamentals should still decide what deserves our attention. Technicals can help decide when the risk/reward of acting on that research has improved.
That distinction matters.
If you are investing with a multi-year view, the chart should not replace the work. It should pressure-test the work.
The mistake: confusing long-term investing with ignoring price
Long-term investors often say, "I do not care what the stock does this quarter."That can be the right mindset. But it can also become an excuse to ignore useful information. Price is not truth. But price is evidence. It reflects liquidity, positioning, incentives, fear, forced selling, anticipation, and sometimes information that has not yet shown up cleanly in the financial statements.
A stock can be fundamentally attractive and still be a poor entry at a given price. A company can be improving underneath while the market is still digesting old disappointment. A great business can stay cheap for years if there is no catalyst and no new buyer base.
Technical analysis is useful when it helps us answer one practical question:
Is the market beginning to recognize the same change we see in the fundamentals?
Technicals are a timing layer, not a thesis
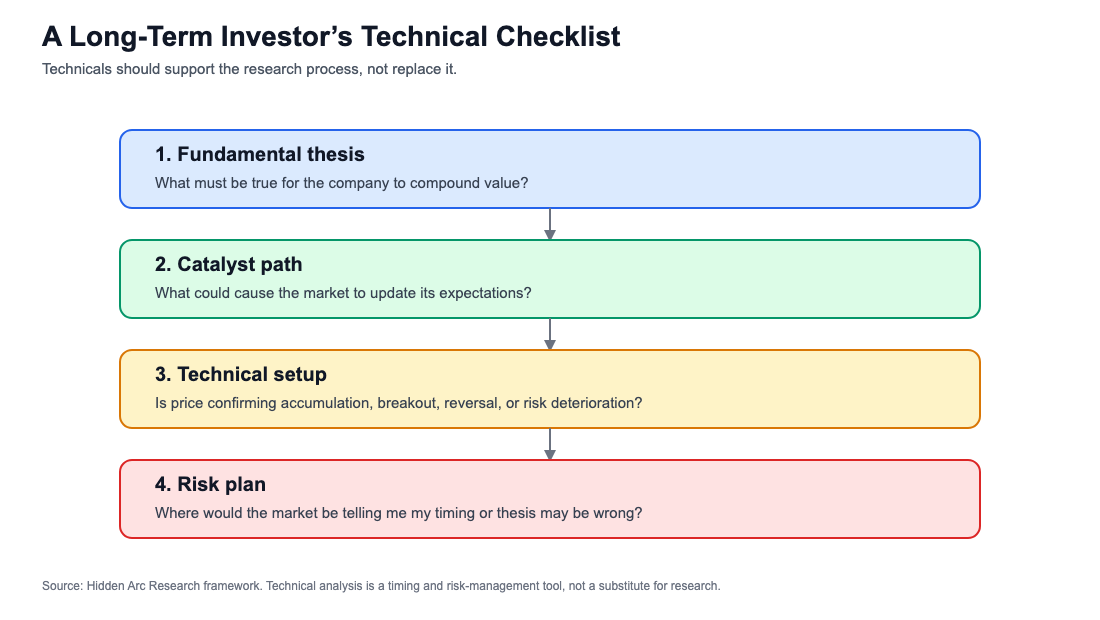
The hierarchy should be simple:
1. Fundamental research tells us what could be mispriced.
2. Catalysts tell us why the market might update.
3. Technicals tell us whether buyers and sellers are starting to behave differently.
4. Risk management tells us when our timing, or possibly our thesis, may be wrong.
That is the version of technical analysis that fits long-term investing.
Not "the chart says buy."
More like:
"The fundamental setup is improving, the catalyst path is credible, and the price action suggests the market may finally be absorbing the old supply."
That is a very different kind of statement.
Signal 1: trends and reversals
The simplest technical signal is also one of the most useful: trend. A stock in a durable uptrend is showing persistent demand. A stock in a durable downtrend is showing persistent supply. Neither tells you whether the business is good or bad, but both tell you something about how the market is treating new information.
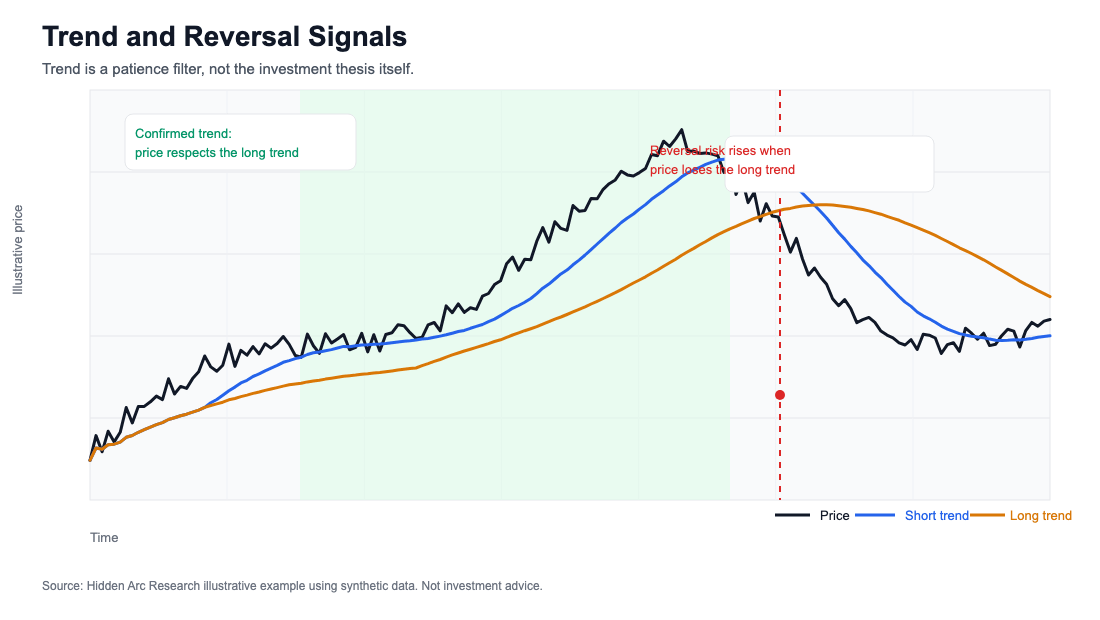
For long-term investors, the value is not in trying to catch every wiggle. It is in avoiding unnecessary fights. If the thesis is improving but the stock is still making lower highs and lower lows, the market may not be ready yet. That does not mean the idea is wrong. It may mean the shareholder base is still turning over, estimates are still falling, or the catalyst has not become visible enough.
On the other hand, when a long downtrend starts to flatten, reclaim key moving averages, and hold higher lows, the stock may be telling us something important:
The seller base is becoming exhausted.
That is often when overlooked stories become investable again. The key is to connect trend changes to fundamental changes. A reversal without a business reason is just price movement. A reversal that appears after margins stabilize, backlog improves, management changes capital allocation, or a product cycle begins to inflect is more interesting. The chart should make you ask better questions, not stop asking questions.
Signal 2: technical breakouts
A breakout happens when a stock moves above a level where sellers previously appeared. For traders, that may be enough. For long-term investors, it is only useful if we understand why the breakout may be happening.
Breakouts can matter because they show a change in market structure. A stock may spend months moving sideways while early investors sell into strength and new investors slowly build positions. That base can be frustrating to watch. But it can also represent absorption.When price finally breaks above the old range, it may signal that the old supply has been cleared.
This is especially useful in companies where the story is changing gradually:
A cyclical business moving from trough to recovery.
A software company moving from growth-at-any-cost to profitable growth.
A semiconductor supplier entering a new product cycle.
An infrastructure company with a backlog that the market has not fully appreciated.
A small-cap company beginning to earn institutional attention.
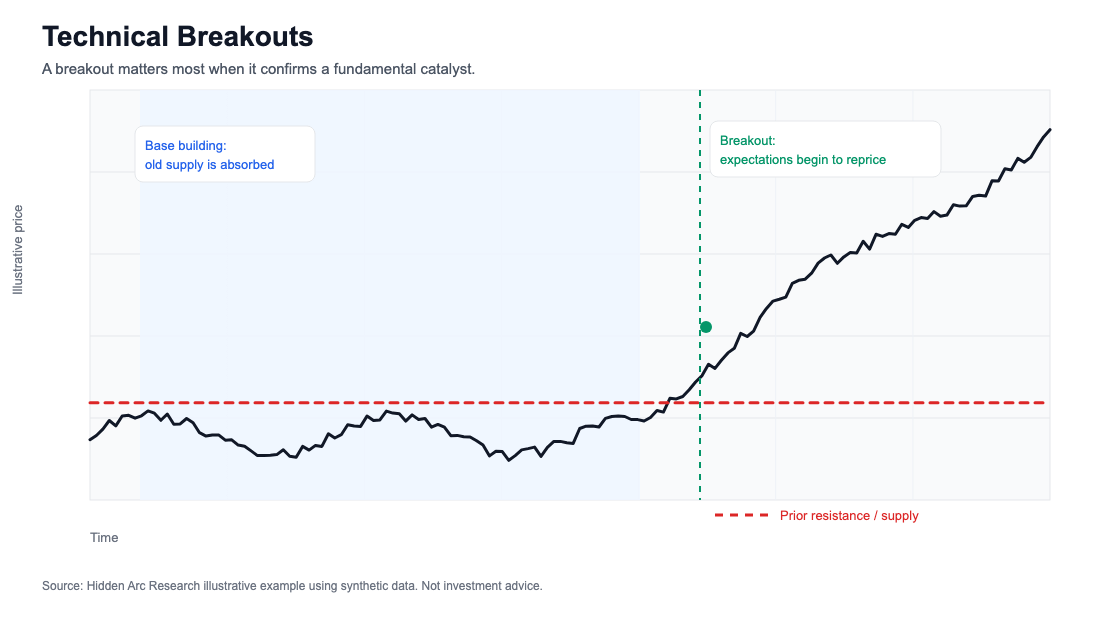
The breakout itself is not the reason to buy. It is evidence that the market may be starting to recognize the reason. A good breakout should usually come with at least one fundamental companion:
Improving revenue visibility.
Estimate revisions turning positive.
Margin pressure easing.
A balance sheet concern fading.
A new customer, product, or regulatory catalyst.
Management execution starting to match prior promises.
Without that, the breakout may simply be momentum. With it, the breakout may be the first visible sign that a hidden catalyst is no longer hidden.
Signal 3: gap fills
Gaps are interesting because they represent forced repricing. A stock gaps up when new information arrives and buyers are willing to pay far above the prior close. A stock gaps down when the opposite happens. The mistake is assuming every gap means the same thing. Some gaps are exhaustion. Some are discovery. Some are overreaction. Some are the beginning of a new valuation regime.
For long-term investors, the useful question is:
Does the business reality validate the gap?
If a company reports a strong quarter and the stock gaps up, the market is saying expectations were too low. But often, after the initial excitement, the stock pulls back into the gap zone. That pullback can be useful if the thesis remains intact. It gives the investor a better entry without requiring them to chase the first emotional move. Gap fills can be especially useful after earnings.
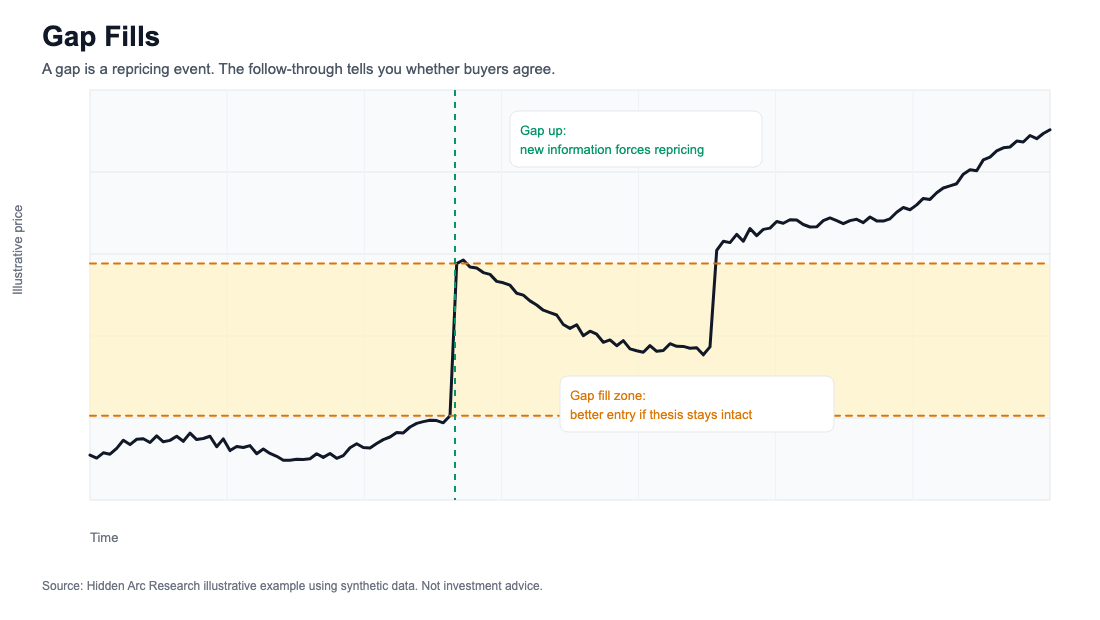
Imagine a company reports:
Stronger bookings.
Better gross margins.
A cleaner balance sheet.
Improved guidance.
Evidence that a feared slowdown is not materializing.
The stock gaps up 20%.
That move may be deserved, but chasing it immediately can still be uncomfortable. If the stock later fills part of the gap while the fundamental takeaway remains unchanged, the long-term investor may get a better risk/reward setup. Again, the chart is not the thesis. The chart is helping translate the thesis into an entry plan.
Using technicals for exits
Long-term investors do not need to sell just because a chart weakens. But they should notice when price action starts contradicting the story.
There are a few situations worth watching:
A stock breaks down after a supposed positive catalyst.
A breakout fails quickly and falls back into the old range.
A former support level becomes resistance.
A stock keeps making lower highs even as management tells a confident story.
Volume expands on down days and disappears on up days.
None of these automatically mean the thesis is broken. But they are signals that the market may not be seeing what we expected it to see.
That should trigger a research review:
Did the catalyst fail?
Did expectations move too far ahead of reality?
Are estimates too high?
Is there a balance sheet or dilution risk the market is pricing in?
Are insiders, customers, or competitors sending a different signal?
The best investors are not stubborn. They are patient. There is a difference. Patience means letting a good thesis play out. Stubbornness means ignoring accumulating evidence that the thesis may be wrong.
A practical framework
When I look at a long-term idea, I want the fundamentals first.
But before buying, I like to ask:
What is the business signal?
What is the market missing?
What could make the market care?
Is the chart showing accumulation, apathy, or distribution?
Where would I admit that my timing is wrong?
What evidence would make me admit that my thesis is wrong?
Those last two questions are not the same. Bad timing means the thesis may still be right, but the market is not ready. A broken thesis means the business evidence has changed. Technical analysis can help separate those two problems.
Where technical analysis fails
There are limits. Charts do not understand management quality. They do not know whether a new product is technically superior. They cannot tell you whether a customer cohort is improving. They do not reveal whether capital allocation is disciplined. They cannot value a business through a full cycle.
They can also create false confidence. A chart pattern can look clean while the actual business is deteriorating. A breakout can fail. A gap can fill for good reason. A trend can reverse because the fundamentals were worse than investors realized. That is why technical analysis should be subordinate to research. It is a tool for timing, probability, and risk management. It is not a substitute for understanding the company.
The real value: better behavior
For long-term investors, the biggest benefit of technical analysis may not be prediction. It may be behavior.
A simple technical framework can prevent three common mistakes:
1. Chasing a stock immediately after a headline.
2. Averaging down into a deteriorating trend without new evidence.
3. Selling too early when both fundamentals and price action are improving.
The goal is not to become a trader. The goal is to become a more disciplined long-term investor. Fundamental research helps us find the hidden arc of a business before it becomes obvious. Technical analysis can help us see when the market is beginning to trace that arc in price.
That is where the two approaches can work together.
Not prediction. Preparation.
Not chart worship. Better timing, better risk control, and better patience.
That is the version of technical analysis worth keeping.
DISCLAIMER
The information, opinions, research, analysis, and content shared by this group/page/channel are for informational and educational purposes only and should not be considered financial, investment, legal, tax, or other professional advice.
I am not a licensed financial advisor, broker, accountant, CPA, or investment professional. I do not hold any formal finance or accounting designation or degree. I am simply an individual with a personal interest in investing, financial markets, businesses, and securities analysis.
Some articles, reports, posts, or materials may be created, edited, summarized, or assisted through the use of artificial intelligence (AI) tools, large language models (LLMs), or other automated technologies. While efforts may be made to review and verify information, AI-generated or AI-assisted content may contain inaccuracies, omissions, outdated information, or errors.
All investments involve risk, including the potential loss of principal. Any investment decisions you make are solely your responsibility. You should conduct your own due diligence and consult with a licensed financial professional before making any investment decisions.
The views and opinions expressed are based on personal research, interpretations, assumptions, and speculative forward-looking opinions that may be incomplete, inaccurate, outdated, or incorrect. There is no guarantee that any projections, forecasts, expectations, or opinions discussed will materialize.
I may hold long or short positions in securities, cryptocurrencies, or other assets mentioned at any time before, during, or after discussing them publicly. I may buy, sell, increase, reduce, or exit positions without notice. As a result, I may financially benefit if securities discussed increase in value, trading activity increases, or market sentiment changes following public discussion of those securities.
By viewing or using this content, you acknowledge that I shall not be held liable for any losses, damages, or financial harm resulting from the use of any information, opinions, or materials provided. Your use of this content constitutes acceptance that all investment decisions are made entirely at your own risk.
Past performance does not guarantee future results.
This analysis is particularly interesting when it redefines charts not as a predictive tool, but as a means of validating consensus: a study by JPMorgan shows that 90% of daily trading volume in the stock markets is now driven by quantitative and passive algorithms.
Incredible. Loved it. Immediate restack! I'm always sharing this exact same mindset, Ted Warrens book taught me how not to average down into losing bets and why I should hold a business when the trend going up over the long term. Technicals are not adverse to fundamentals, technicals SUPPORT fundamentals! And we are all better off combining the two :)